See where your recent training has landed.
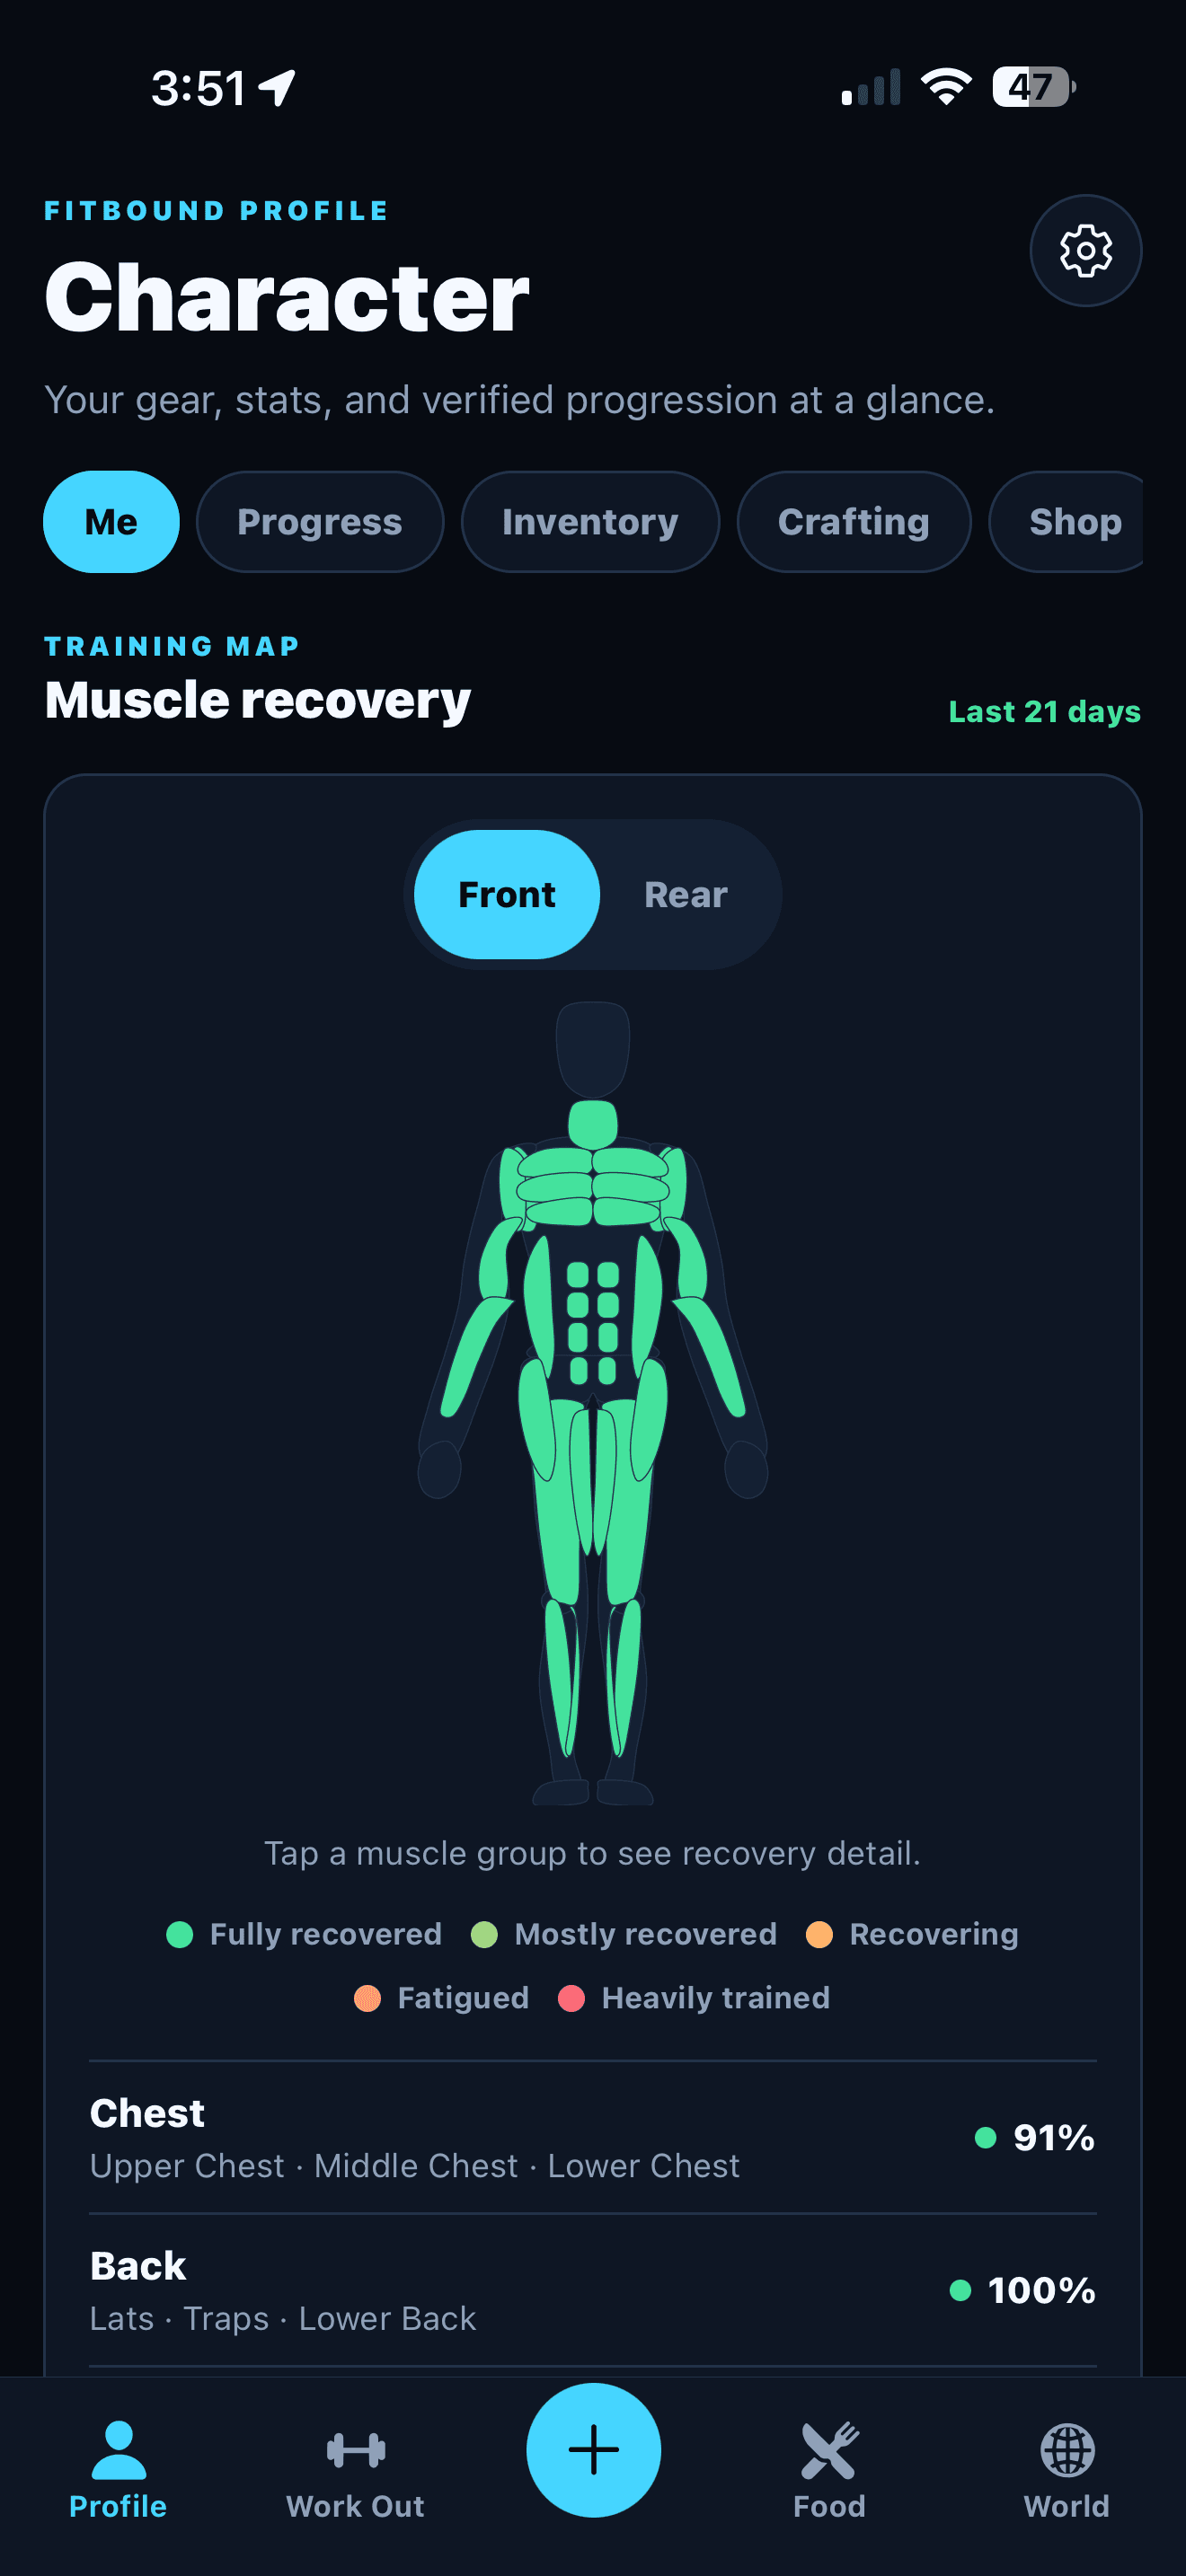
The FitBound body diagram summarizes recent training context; it is not a diagnosis, injury detector, or substitute for medical advice.
Plan around what you trained
Sample recovery data
- ChestFully recovered84%
- ShouldersMostly recovered68%
- QuadricepsRecovering46%
Recovery is a planning signal based on logged training—not a medical assessment.
- Fully recovered 80–100%
- Mostly recovered 60–79%
- Recovering 40–59%
- Fatigued 20–39%
- Heavily trained 0–19%
How it works today
Shipped The diagram uses a simplified, segmented body model — front and rear, with a neutral fallback when a profile hasn't set a body type. It shows no skin, organs, veins, bones, or clinical detail — just regions and a recovery estimate driven by what you've logged.
Untracked regions show a neutral state and the label “Recovery data unavailable” rather than an invented number.
Reading the legend
Every state has both a color and a written label — never color alone. The same five-state legend shown above (Fully recovered, Mostly recovered, Recovering, Fatigued, Heavily trained) is used consistently across the app.